3D maps about the COVID-19 pandemic
The Atlas of Switzerland presents two new 3D maps on the COVID-19 pandemic, based on data from the Swiss Federal Office of Public Health and the COVID-19 Data Hub. The visualizations are based on a 3D model of the virus and offer an innovative perspective on case numbers, deaths, and recoveries.
January 25, 2021
The Atlas of Switzerland has published two new maps with parametric 3D visualizations about the COVID-19 pandemic. Data originate from the Swiss Federal Office of Public Health and the international Covid-19 Data Hub. The visualizations are inspired by a scientific 3D model of the SARS-CoV-2 virus by Visual Science.
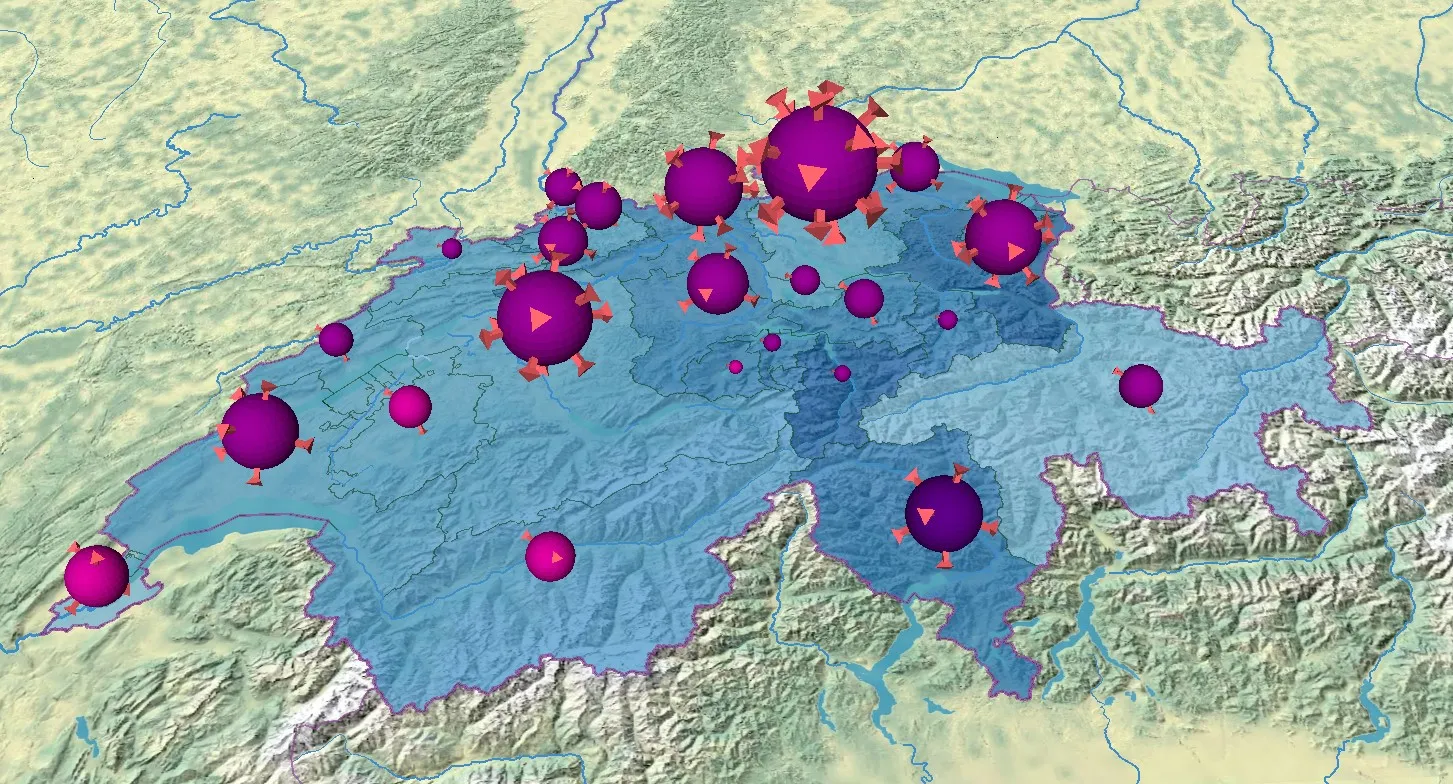
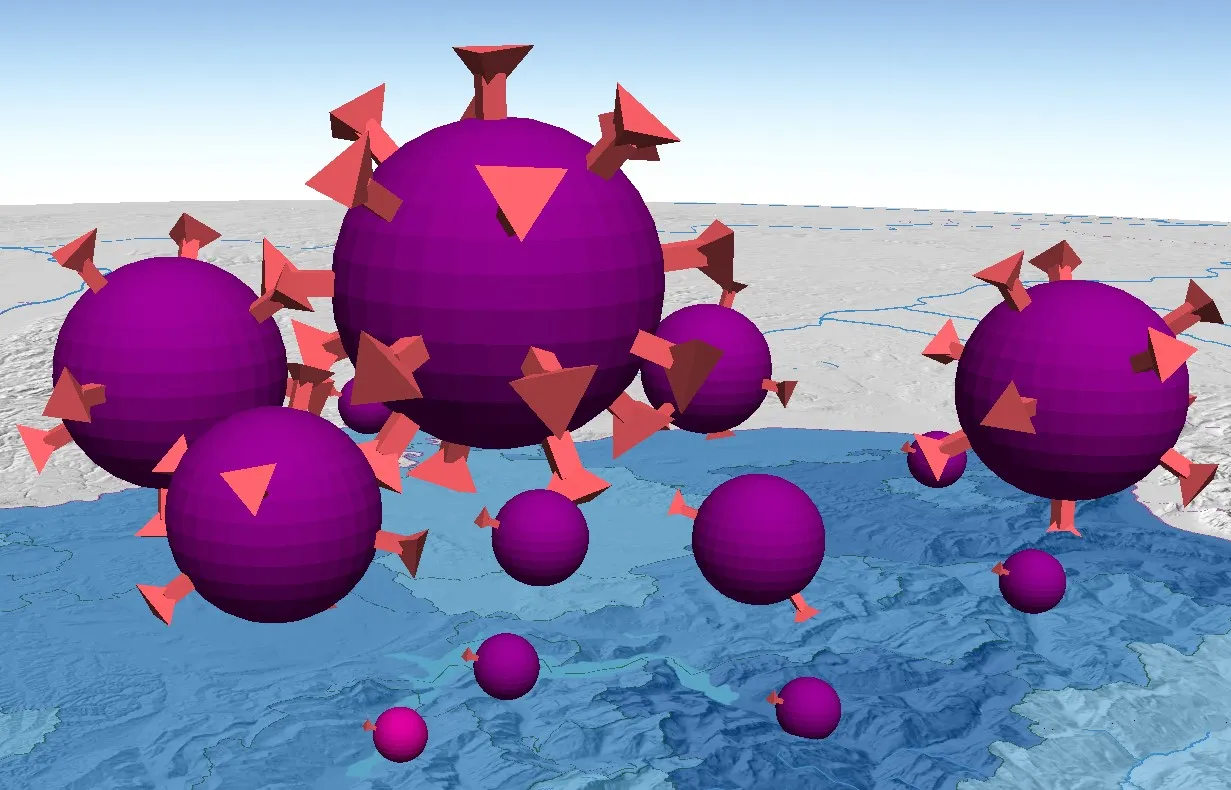
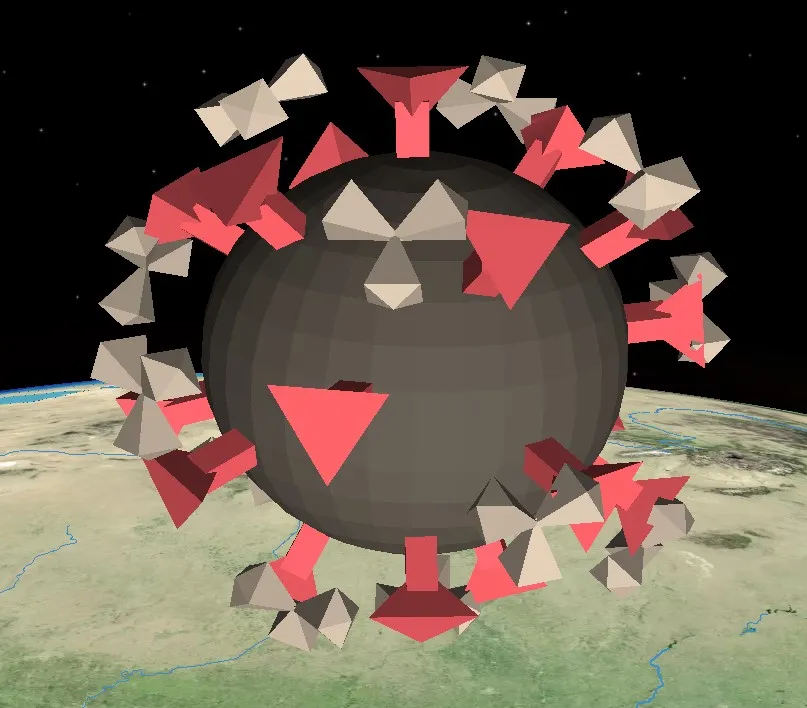
In our abstracted version of the Corona virus model, the radii of the spheres are scaled to the number of cases and cones are attached proportionally to the number of deceased persons. It is possible to choose between monthly and cumulative numbers in year 2020. In the map for Switzerland, the spheres are colored according to the particular incidence and an underlying choropleth layer depicts the positivity rate of tests. In the global map, surrounding antibodies represent the number of recovered persons. The variations between the two maps are due to differences in data availability.
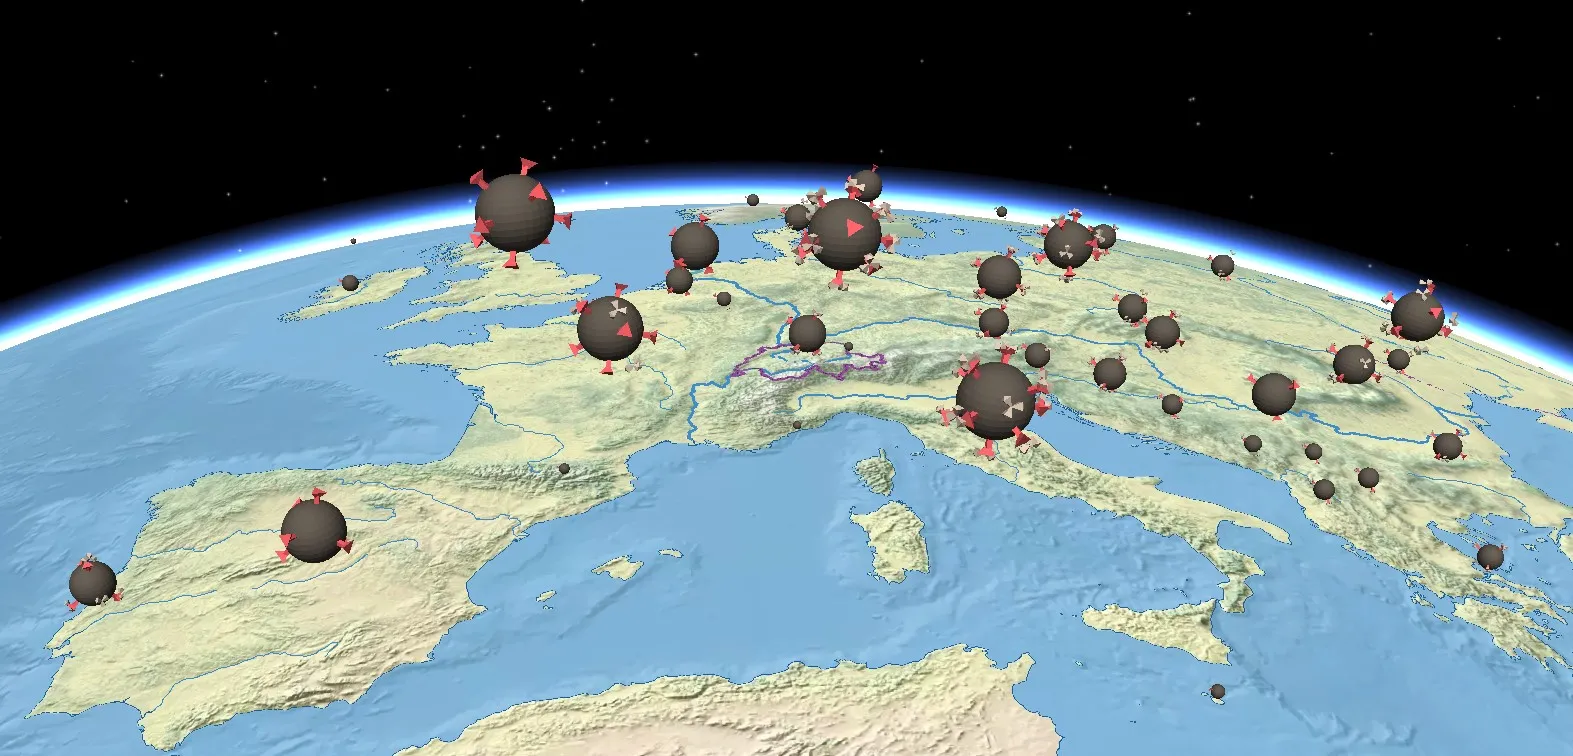
By developing the 3D visualizations, we hope that readers gain new insights to the topic by seeing it from a different perspective and by combining it with other maps from the Atlas of Switzerland. For a quick overview and comparison, we still recommend the usage of existing 2D maps and dashboards. More information on map readers’ effectiveness and efficiency with 2D and 3D charts can be found in this publication.