News

Back to Overview

Review of the year in maps – 2022

2022 was an eventful year – from the Ukraine war to the energy crisis, from the dry summer to sporting highlights: For every event, you can find a corresponding map in the Atlas.

December 23, 2022

The year 2022 was an eventful one. At the turn of the year, we would like to take a look at the past year together with you. We have collected the most important events and developments of the year 2022 for you in the form of maps from the «Atlas of Switzerland». We wish you a lot of fun, a happy new year and look forward to welcoming you again in 2023.

January

The Covid-19 variant Omikron is spreading. Many people get vaccinated with a booster.

Map of Switzerland showing COVID cases, the number of deaths, and the number of vaccinated people per canton using 3D symbols. The cantons are colored in shades of blue.
Covid-19 pandemic in Switzerland

February

Invasion of Ukraine by Russia on Feb. 24, 2022, four years after the occupation of Crimea.

Map of Switzerland depicting the Helvetic Revolution and the French invasion of 1798 using arrows and symbols. The cantons are colored in shades of pink and green.
Helvetic revolution and Invasion of the French troups 1798

March

Due to the war in Ukraine, the Olympic Games in Beijing take a back seat. From March 4 to 13, the Paralympic Games take place.
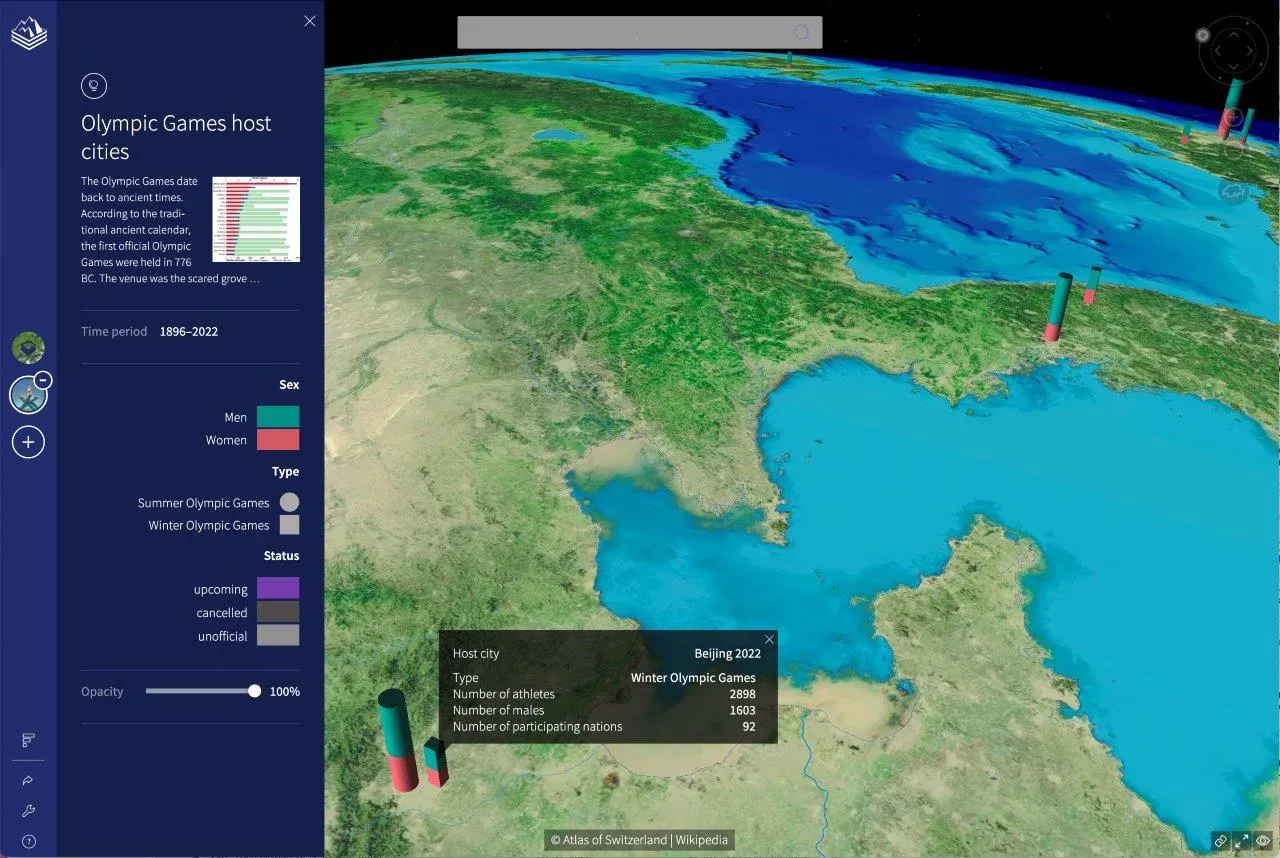
Map of a region of Asia that uses 3D cylinders to display information about the hosting of the Olympic Games.
Olympic Games host cities

April

Solar cells for the night? Researchers from Stanford have developed something: Solar Panels That Make Electricity at Night are Finally Here – And They’re Cheap and Don’t Need Batteries. In addition, wind and solar energy cover 10% of the world’s electricity supply: Wind And Solar Generated a Record 10% of the World’s Power in 2021 – Victory for Paris Agreement.

Map of Switzerland with symbols representing wind turbines, and cantons colored in colors ranging from yellow to brown.
Solar electricity production: making use of roof space and wind power installations

May

The running events SOLA in Zurich and the Grand Prix Bern are finally taking place again, after a 2 year break!
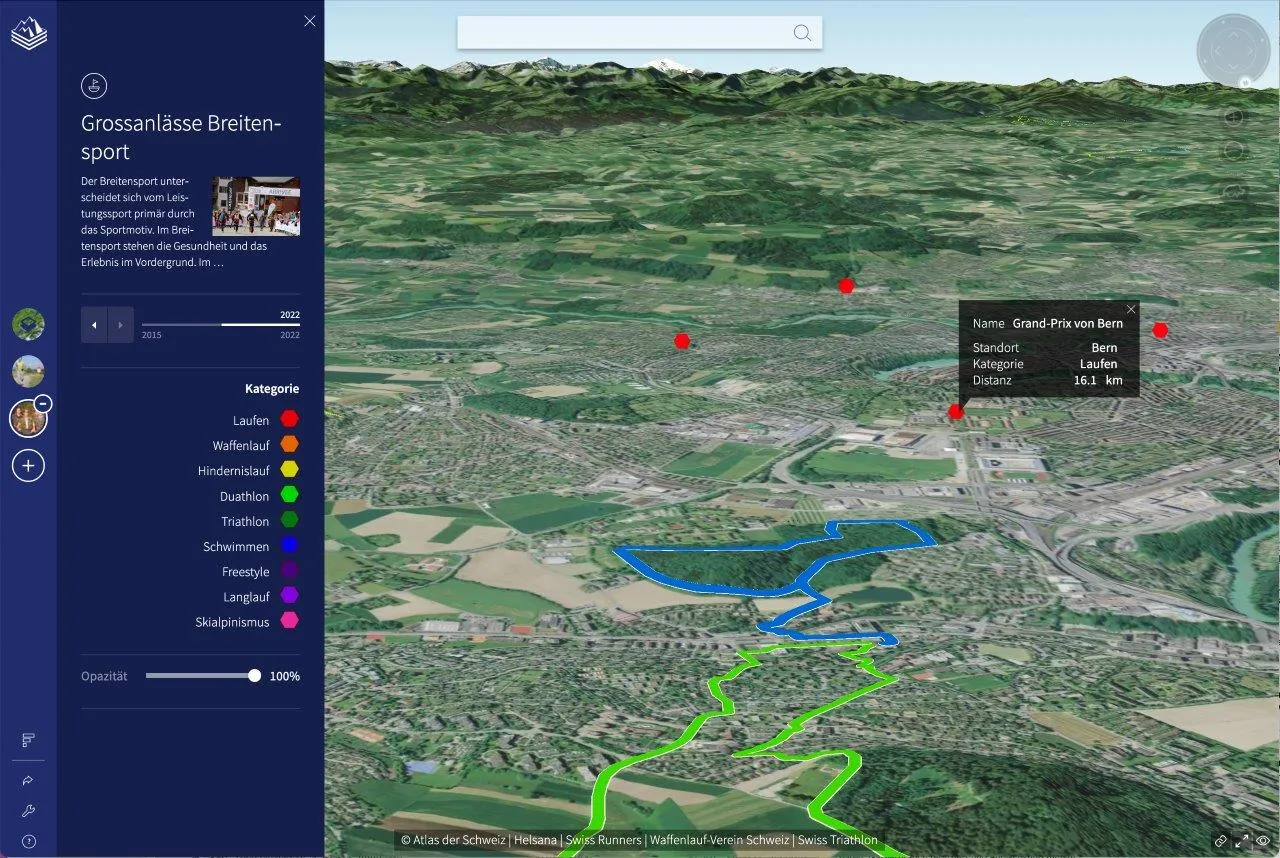
Map of the Bern region with red dots representing running events, as well as blue and green lines representing the Helsana Trails.
Major events in popular sport and Helsana Trails.

June

The summer is very dry and hot. As a result, the forest also suffers.

 Map of a region in Switzerland with 3D symbols in the shape of trees, colored in gradients from brown to green and shown in various shapes.
State of the Swiss forest (NFI)

July

After two pandemic years, more distant foreign destinations are becoming attractive to travel to again. In some cases, however, there are long waiting times and flight cancellations.

Map of Europe using lines to show flight routes and the number of passengers on international flight connections.
Scheduled flights: passengers transported on international flight routes

August

In August, inflation reaches 3.5%, the highest value compared to the previous month for the year 2022 [Switzerland: Inflation rate from 1987 to 2027]. Banks are gradually saying goodbye to negative interest rates.
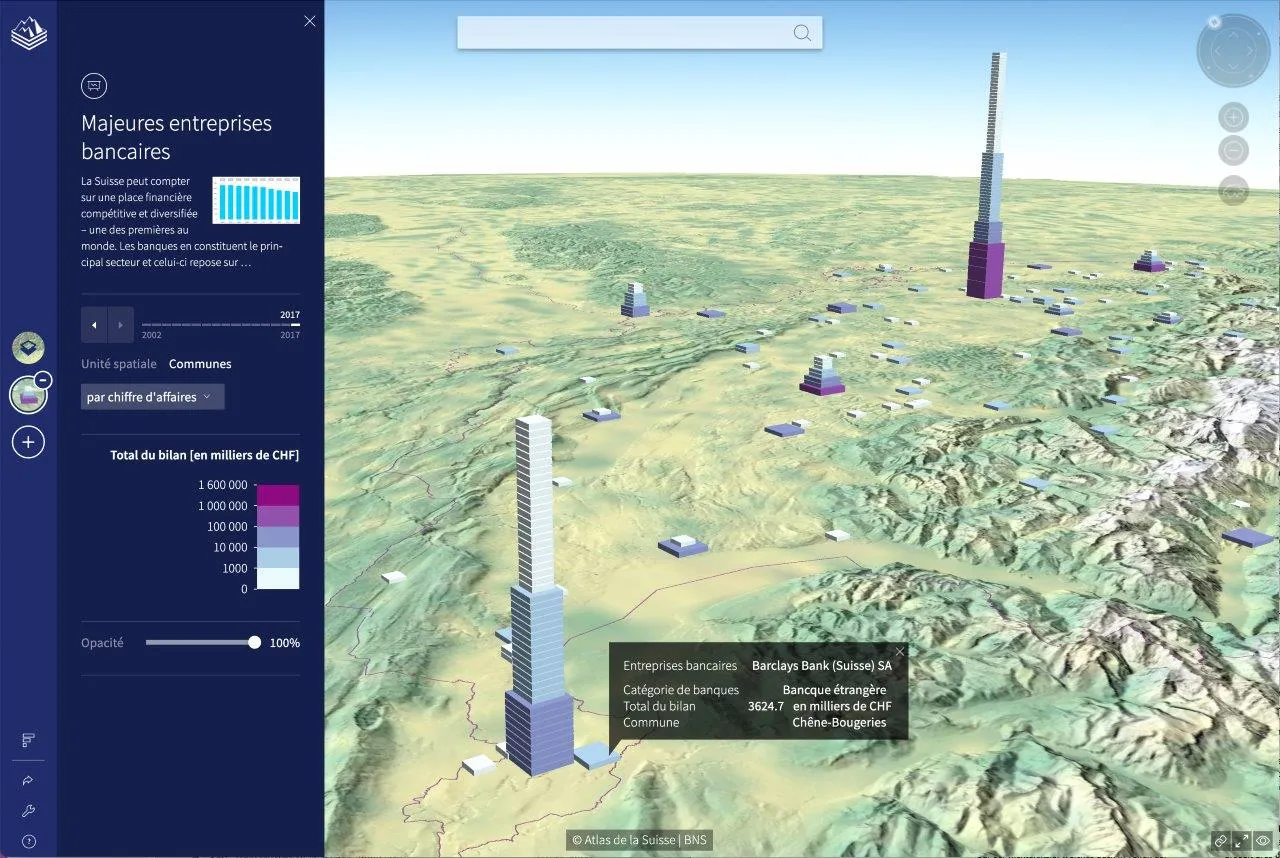
Map of a part of Switzerland that uses 3D rectangles to display information about the major banks.
Major bank companies

September

On September 10 at 17:58, an earthquake occurred near Mulhouse (FRA) with a magnitude of about 4.7 on the Richter scale, which was also felt in large parts of German-speaking Switzerland.

Map of Switzerland showing the epicenters of earthquakes using red and orange dot symbols.
Earthquakes: noticeable events, magnitude 2.5+, since 1975

October

Lack of gas supplies from Russia leads to a massive increase in electricity prices. Measures are taken to save energy.
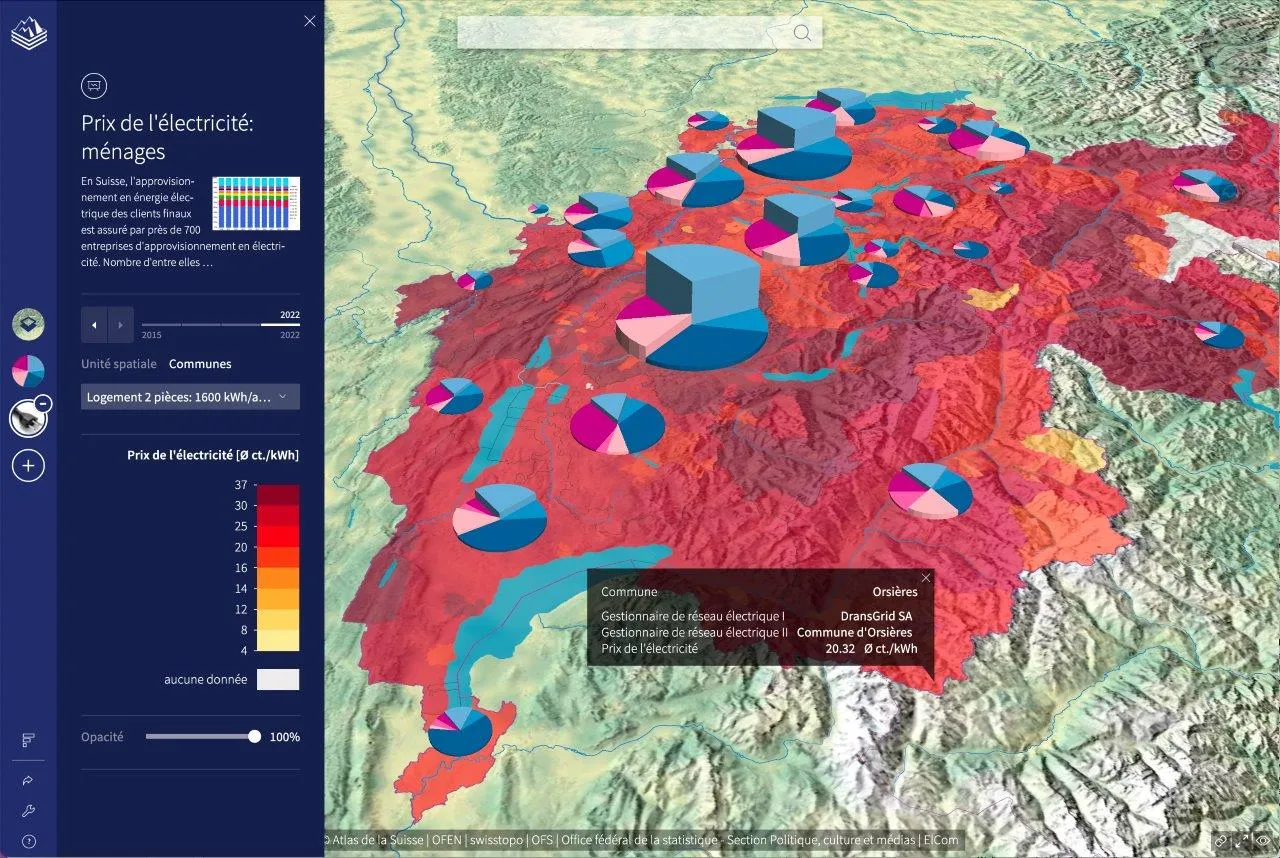
Map of Switzerland displaying information about automatic wood-fired heating systems using 3D pie charts in tones from violet to blue. The cantons are colored from yellow to red, depending on electricity prices.
Electricity prices: households and automatic wood-fired heating systems

November

On November 15, the eight billionth person is born in the world. More than one thousandth of the world’s population lives in Switzerland (8.6 million inhabitants), which, however, accounts for only one ten-thousandth of the world’s area (41,000 km² to 510 million km²).
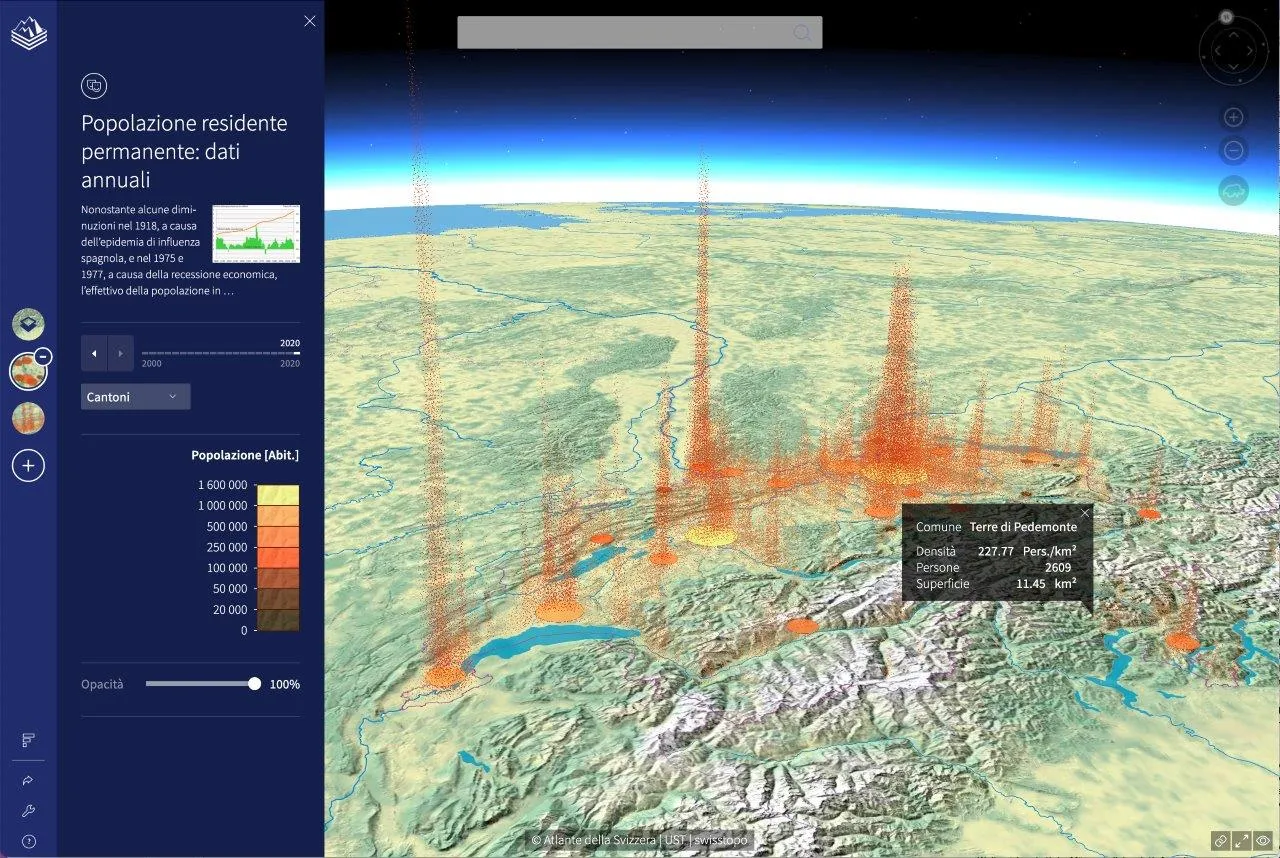
Map of Switzerland showing population density using colored point clouds in tones from yellow to red. Additionally, colored circles in tones from brown to yellow indicate the number of inhabitants per canton.
Population density: point clouds and resident population: annual data

December

On December 18, the final of the Men’s World Cup took place in Qatar; Argentina won in a penalty shootout against France. In addition to FIFA, several other sports federations have their headquarters in Switzerland.

Map of a region in Switzerland displaying information about national and international sports associations based in Switzerland, using symbols with different geometric shapes and colors.
Swiss national sport associations and international sport associations with headquarter in Switzerland

More News from the Editorial Team

Discover the Atlas of Switzerland: Scientifica – EuroCarto – Open Visualization Collaborator Summit

August 17, 2026

Export Function and Feature Search – June 2026

June 19, 2026

News from the Atlas of Switzerland – Spring 2026

April 21, 2026